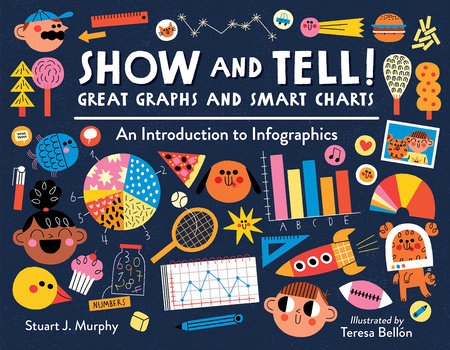
A project-based introduction to graphs and charts is presented with bold illustrations and engaging text as Murphy brings his wealth of kid-friendly math expertise to the world of infographics. Two classmates, a Black girl and a white boy, navigate each type of graph or chart. They explore bar graphs, pictographs, pie charts, and line graphs. With each one they focus on a real-world topic such as favorite meals, burps in a week, most common household pets in their school, and amusement park rides. Each chapter clearly explains how to gather the data, track the data on a table, and then transfer that information on to the appropriate type of visual. Dialogue bubbles between the two students add humor, while side bars show them extending the collection and interpretation of data. This title could be used as an introduction or as a refresher depending on the age group. Younger students might need a bit of front-end work with vocabulary definitions for words such as data, trend, and diagram. The book ends with suggestions for creating a personal infographic, combining many of the charts and graphs explored in the book.
VERDICT This STEAM title is a valuable purchase where math and literary nonfiction are in demand.
—School Library Journal